🎯 Turning Point Indicator System
A Systematic Approach to Identifying Market Reversals
A NinjaTrader 8 system that combines three reversal detection methods with quantified signal strength analysis to help you identify potential turning points with greater confidence.
⚠️ Common Reversal Trading Challenges:
- Lagging indicators — RSI, MACD, stochastics often confirm after significant price movement
- False signals — Difficulty distinguishing between real reversals and temporary retracements
- Second-guessing entries — Uncertainty about whether a turning point is forming
- No signal differentiation — All setups appear equal until you’re in the trade
- Inconsistent results — What works in backtest doesn’t always translate to live trading
The challenge: Identifying high-probability reversals while filtering out low-quality setups.
✅ How the Turning Point System Helps
🔍 Triple Confirmation System
Unlike single-indicator systems, this uses THREE independent methods:
- MeanRenko Bars — Filters noise, shows cleaner price structure
- Turning Point Detector — Identifies potential reversals in real-time
- Trend Confirmation — Visual bar color change provides additional confirmation
All three elements work together to help identify potential setups.
🎨 Color-Coded Signal Strength
Not all reversals are equal. The system quantifies signal quality on a 0-100% scale:
- Light Green = Weak (50-60%) — Lower confidence
- Green = Medium (60-75%) — Moderate confidence
- Dark Green = Strong (75-85%) — Higher confidence
- Darkest Green = Very Strong (85-100%) — Highest confidence
Same color logic for sell signals (light to dark red).
🛡️ Advanced Pro Filters (Included)
Built-in filters to help eliminate lower-quality setups:
- Volatility Filter — Adjusts to current market conditions
- Momentum Alignment — Checks price direction
- Trend Quality Check — Evaluates trend consistency
- Risk/Reward Calculator — Measures potential R:R ratio
- Signal Spacing — Controls signal frequency
Customize which signals appear based on your criteria.
⚠️ Important Trading Disclaimer
Not every trend change results in a profitable trade. The Turning Point System is a tool for identifying potential reversals, not a guarantee of trading success. Always wait for confirmation when signals are unclear, use proper risk management, and understand that all trading involves risk. Past performance does not guarantee future results.
📊 How the 3-Point System Works
A systematic approach suitable for both beginners and experienced traders.
Step 1: MeanRenko Bar Structure
MeanRenko bars eliminate time-based noise by printing only when price moves a meaningful amount. Instead of random 1-minute bars that cluster during volatility and go silent during consolidation, you get uniform bricks that help reveal underlying price structure.
Why this matters: Indicators like RSI and EMAs can respond to actual price movement rather than arbitrary time intervals.
Step 2: Turning Point Signal (Arrow)
The indicator analyzes 24 independent K-parameter systems simultaneously—each tracking different bar lengths and reversal conditions. When multiple systems agree on a directional change, an arrow appears.
How it works: The system weights each K-system by its recent performance. Systems with better historical accuracy receive more influence in the consensus calculation.
- 🟢 Upward arrow = Potential long setup (possible reversal from down to up)
- 🔴 Downward arrow = Potential short setup (possible reversal from up to down)
Note: The arrow alone is just the first indication. Step 3 provides additional confirmation…
Step 3: Trend Line Confirmation
The trend-following component enters trades later than the arrow but can help identify sustained moves. It provides visual confirmation through bar color changes.
Visual confirmation: When bars change from RED (downtrend) to BLUE (uptrend), it suggests the reversal may be developing. This can serve as your entry confirmation.
Two Trading Approaches:
Aggressive: Consider entry on the turning point arrow. Add position when trend line confirms (color change). This provides earlier entry but may result in more false signals.
Conservative: Wait for BOTH the arrow AND the color change before entering. This provides more confirmation but potentially later entry points.
🎯 Signal Examples
Signal 1: Turning Point Arrow
An arrow marks this signal, indicating a potential change in direction. For example, an upward arrow with blue bars suggests a possible long setup.
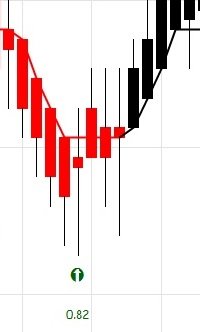
Signal 2: Trend Line Confirmation
This confirmation appears visually when the bar color changes from red (short) to blue (long), suggesting trend alignment.

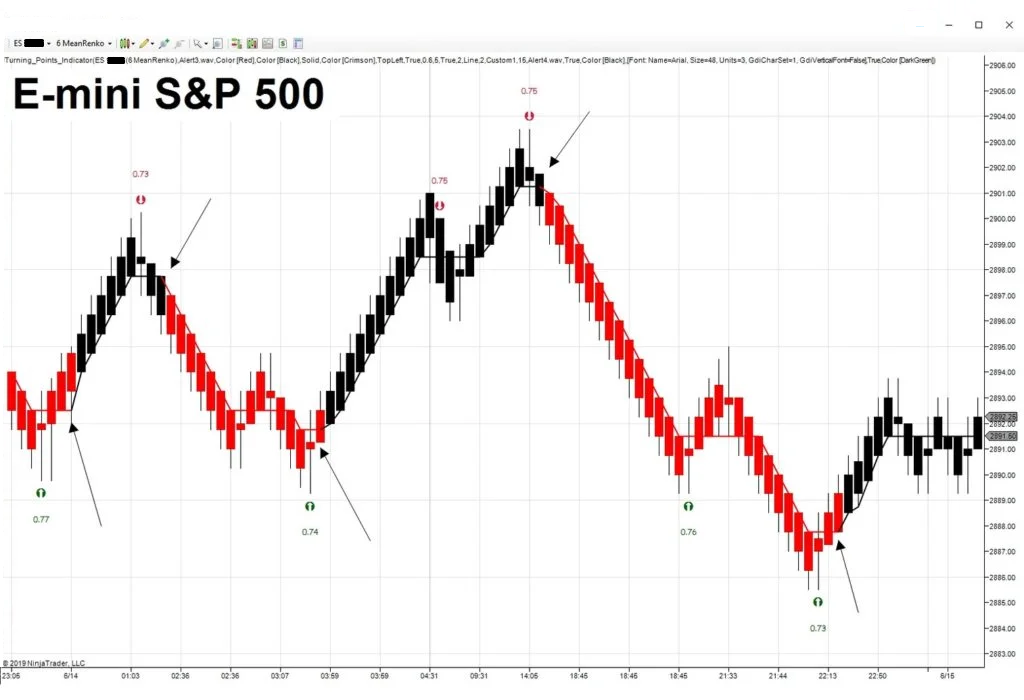
🎥 Watch It in Action
See how the system identifies signals on ES futures with entry points and confirmations
📈 Trade Setup Examples
These screenshots show how the system identifies potential reversals with signal strength indicators.
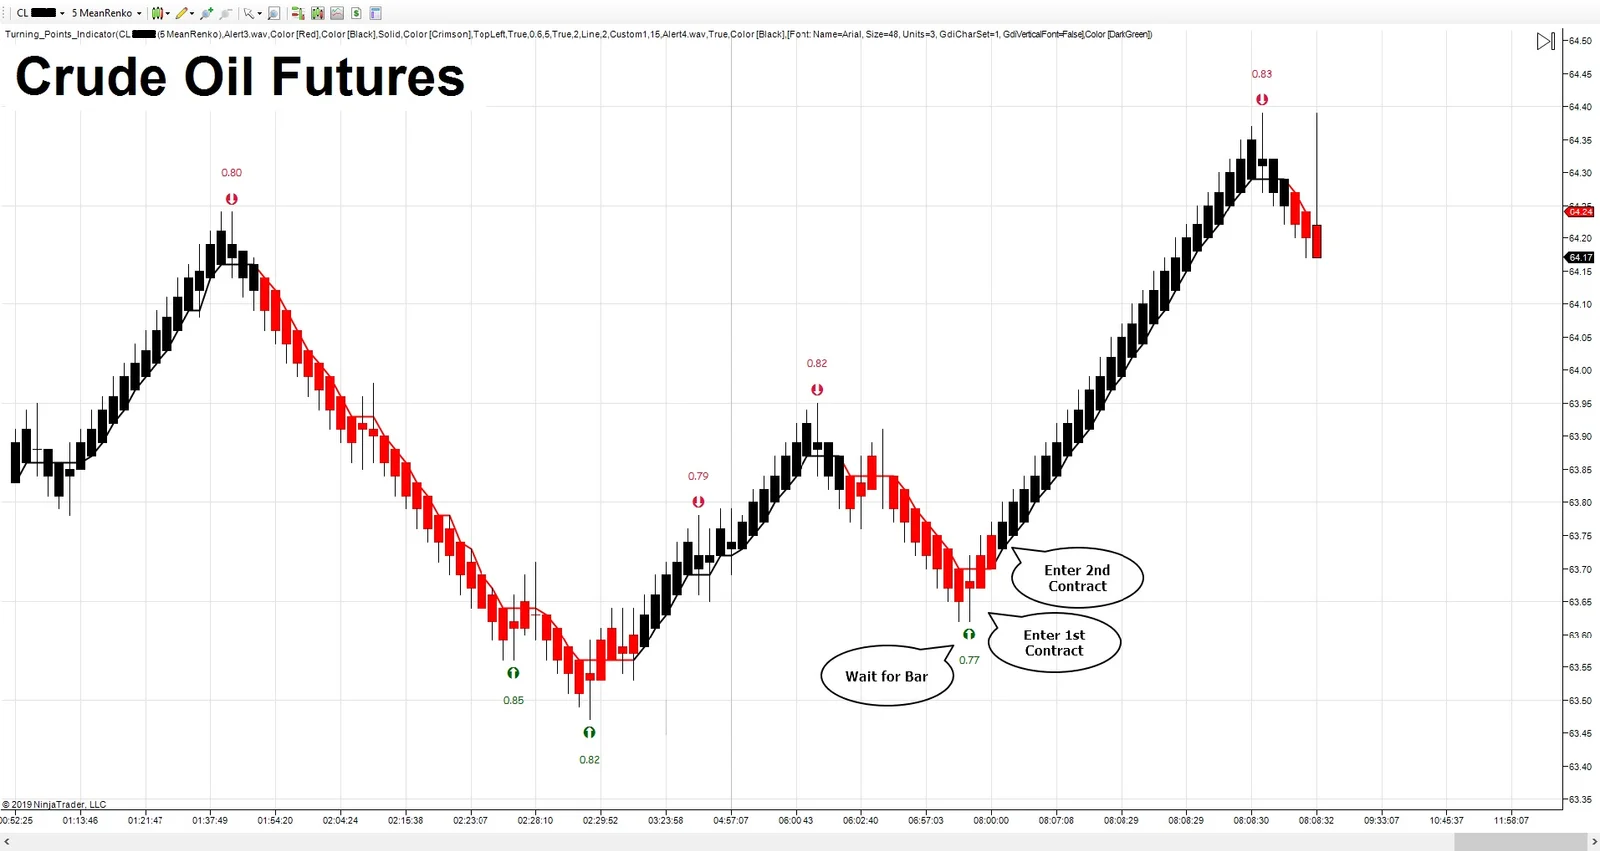
Example showing signal clarity and confirmation workflow
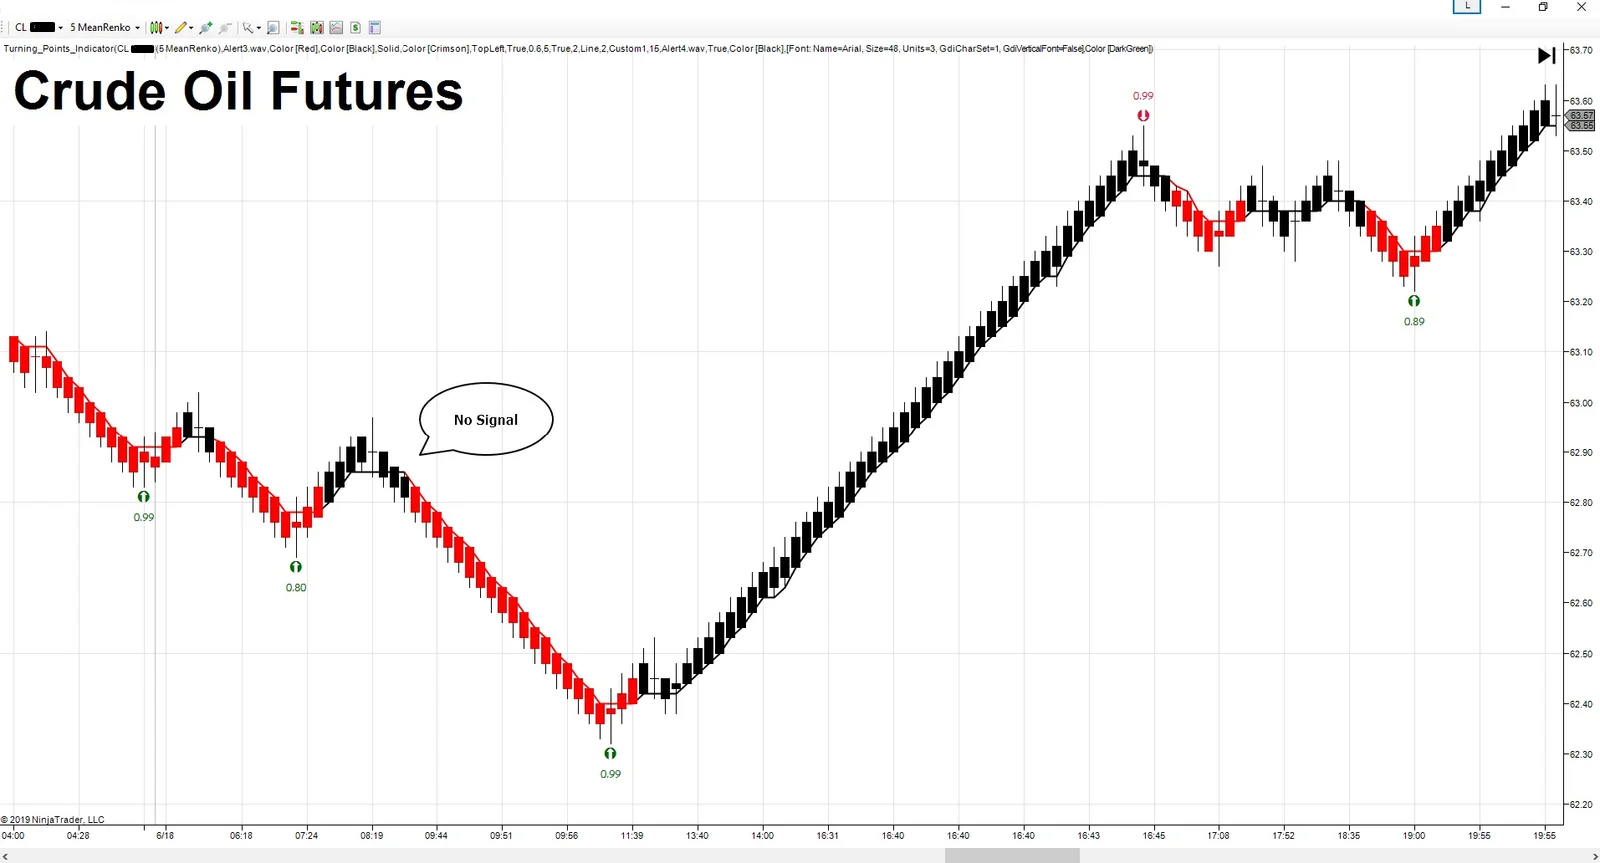
Multiple signals demonstrating the system’s filtering capability
📊 Real Chart Examples
Below are chart examples showing how the system works in live market conditions, including both turning point signals and trend confirmation indicators.
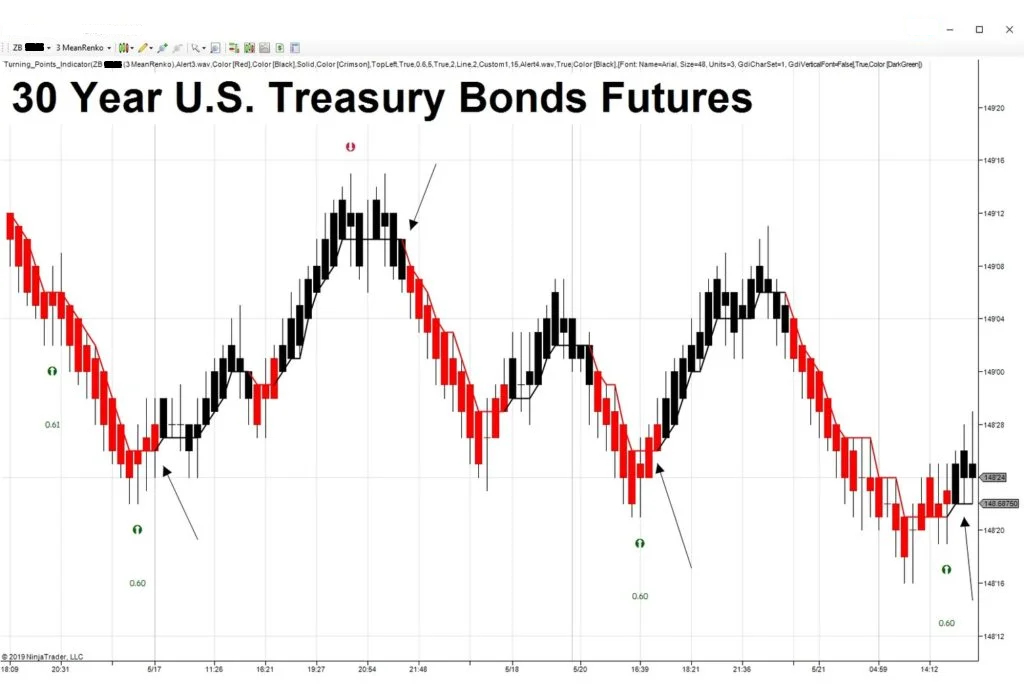
Example showing triple confirmation workflow
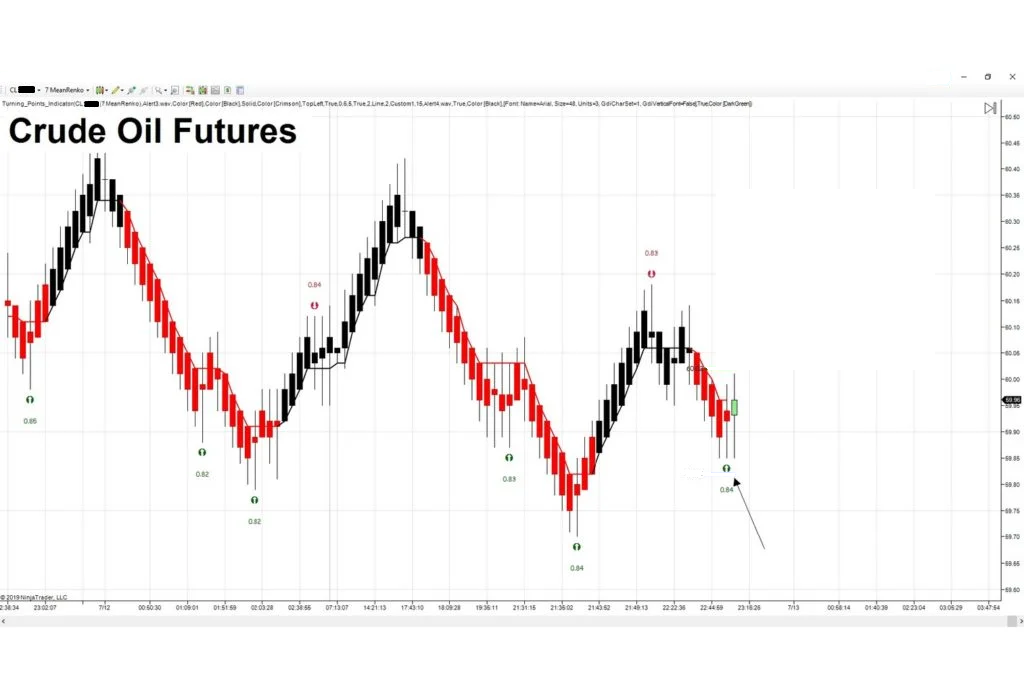
Signal development and confirmation sequence
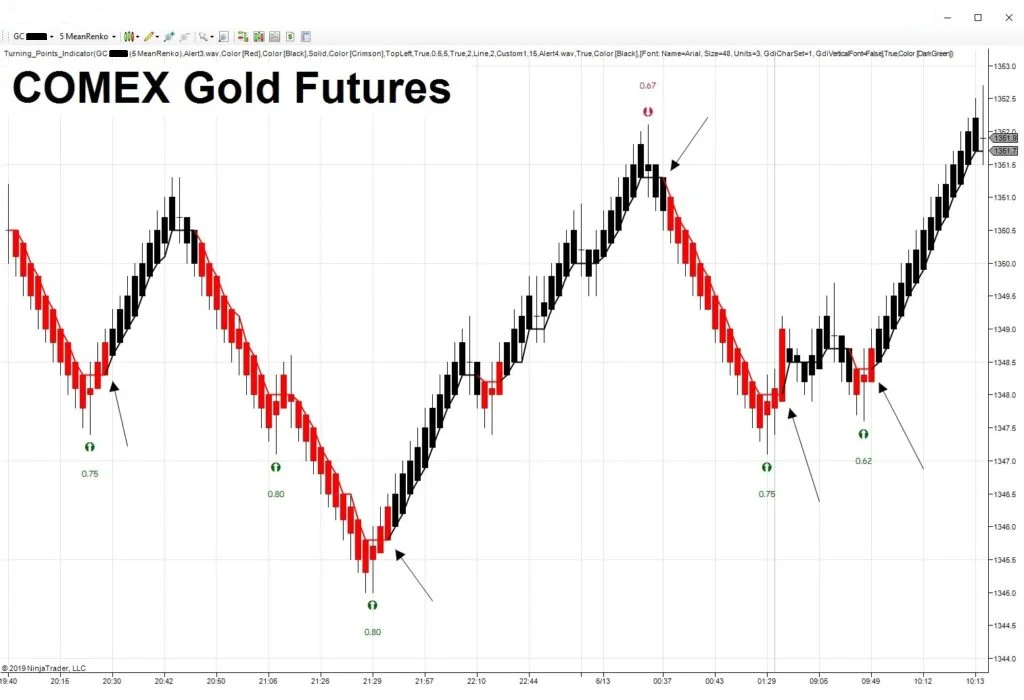
Multiple signals during active trading session
Color-coded strength visualization in practice
🧠 The Technical Foundation
Most reversal indicators rely on a single method (divergence, oversold conditions, etc.). The Turning Point System takes a different approach:
1. Multi-System Consensus (Ensemble Method)
The indicator runs 24 independent K-parameter systems in parallel. Each system uses different bar lengths (K-min to K-max from 3-20) to detect reversals at different scales. When a threshold percentage of systems agree on a direction change, a signal appears. This consensus-based approach is similar to techniques used in quantitative analysis.
2. Dynamic Stop/Target Optimization
Rather than using fixed stops, the system evaluates 324 stop/target combinations (18×18 matrix) based on recent price history to suggest risk/reward parameters that align with current market conditions.
3. Statistical Weight Adjustment
After each signal, the system adjusts the “voting weight” of each K-parameter based on its recent accuracy. More accurate systems receive greater influence, while less accurate ones are weighted lower. This helps the indicator adapt to changing market conditions.
4. Signal Strength Quantification
Each signal receives a 0-100% strength score based on: system agreement percentage, volatility level, momentum alignment, trend quality, and historical performance. This helps you evaluate setup quality before committing capital.
⚙️ What’s Included
📦 Core Components
- Turning Point Indicator (main system)
- Turning Point Trend Indicator
- MeanRenko Bar Type
- Complete PDF guide with setup instructions
- Video tutorial
🎨 Visual Customization
- 5 arrow styles (arrow, diamond, dot, triangle, square)
- Adjustable arrow size & distance
- 4-level gradient color coding (weak to very strong)
- Customizable trend line colors
- Optional bar painting
🛡️ Pro Filters
- Signal strength threshold (0-100%)
- Volatility filter with adjustable period
- Momentum alignment filter
- Trend quality filter
- Minimum risk/reward filter
- Signal spacing control
🔔 Alerts & Performance
- Audio alerts for buy/sell signals
- Optional “strong signals only” alert mode
- Built-in performance tracking
- Win rate & profit factor display
- Real-time signal strength display
🔧 Easy Configuration
The system comes pre-configured with optimized defaults, but every parameter can be adjusted to match your trading approach.
Turning Point Indicator Settings
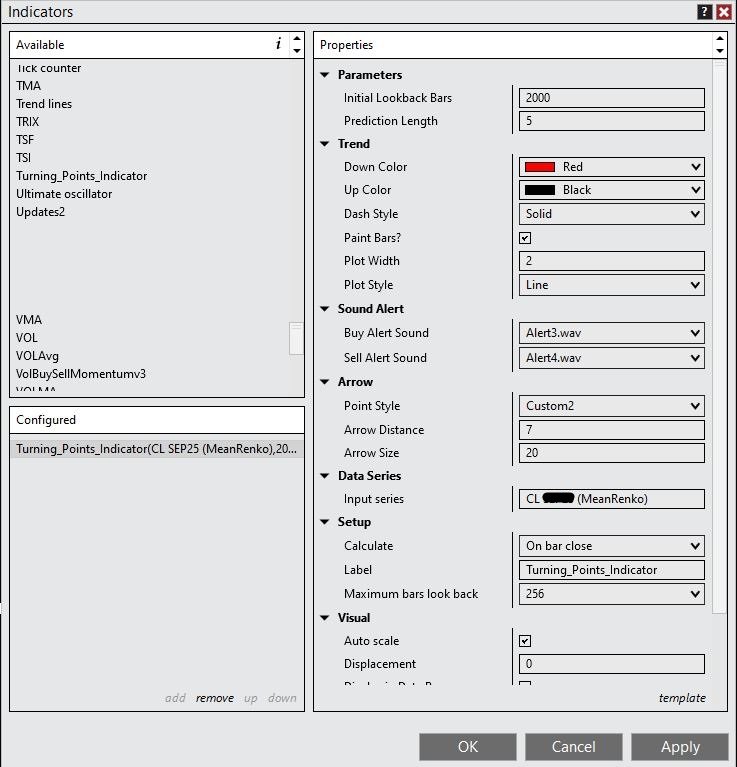
Main indicator settings — adjust prediction length, arrow style, filters, and color thresholds
MeanRenko Bar Settings
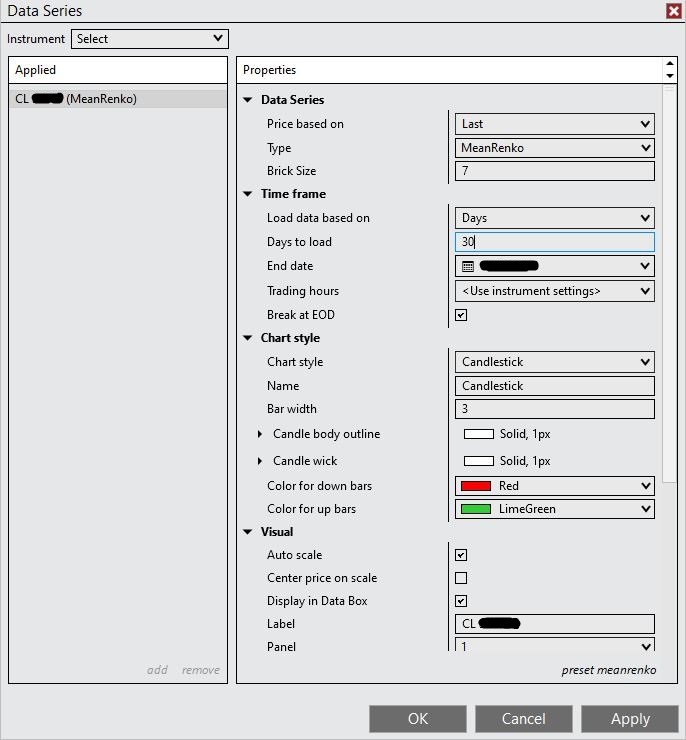
MeanRenko bar type settings — controls bar size and structure
📊 Feature Comparison
| Feature | Turning Point System | Standard RSI Divergence | MACD/Stochastic | Price Action Alone |
|---|---|---|---|---|
| Number of Confirmation Methods | 3 Systems | 1 | 1-2 | 0 (subjective) |
| Signal Strength Indication | Yes (0-100%) | No | No | No |
| Adaptive Filtering | Yes (5 filters) | No | No | No |
| Works on MeanRenko | Yes (included) | No | No | No |
| Statistical Optimization | Yes | No | No | No |
| Signal Timing | Early detection | Often lags | Often lags | Varies |
| Suitable For | All experience levels | Experienced traders | Experienced traders | Very experienced |
❓ Frequently Asked Questions
Q: Will this work on ES, NQ, CL, and forex?
A: Yes. The system is market-agnostic and works on any instrument with sufficient volume and liquidity. Users have applied it to ES/NQ futures, crude oil, gold, and major forex pairs. The MeanRenko bar type automatically adjusts to each instrument’s tick size and typical volatility.
Q: What kind of results can I expect?
A: There is no “holy grail” in trading. This system is designed to help you identify higher-probability reversal setups and filter out weaker signals. Success depends on many factors including your trading discipline, risk management, market conditions, and how you use the signals. Not every signal will be profitable. Some users report improved win rates when focusing on stronger signals (75%+ strength), but individual results vary significantly.
Q: Do I need to use MeanRenko bars, or can I use regular time bars?
A: The indicator works on ANY bar type (time, tick, volume, range). However, MeanRenko is recommended because it filters time-based noise and can produce cleaner signals. The system was designed and tested primarily on MeanRenko. Using standard time bars may generate more signals, including more false ones, due to time-based market noise.
Q: How do I know which signals to take?
A: Use the color-coded strength system as a guide:
- Beginners: Consider focusing only on strong (dark green) or very strong (darkest green) signals while you learn the system.
- Intermediate: Take medium-to-very strong signals and adjust position size based on strength.
- Advanced: Use the Pro filters to customize exactly which setups appear on your chart based on volatility, momentum, trend quality, and risk/reward criteria.
Q: Does this repaint or lag?
A: No repainting. Once a signal arrow prints, it remains fixed. The system calculates on bar close (OnBarClose = true). The multi-system approach is designed to detect potential reversals earlier than single lagging indicators like MACD or stochastics, though some lag is inherent in any indicator-based system.
Q: Can I automate this in a strategy?
A: The Turning Point System is designed for discretionary manual trading. It provides signals and strength assessments—you make the final decision on entries and exits based on your analysis. If you’re interested in full automation, that would require custom strategy development (offered as a separate service).
Q: What’s included in the 7-day trial?
A: The trial is fully functional with all features of the paid version. No limitations. After 7 days, the indicator stops working unless you purchase a license. This gives you time to evaluate it on your charts, markets, and trading style before making a purchase decision.
Q: Is there a money-back guarantee?
A: Yes. 30-day money-back guarantee. If the system doesn’t meet your expectations, request a refund within 30 days—no questions asked.
🎯 Try the Turning Point System Risk-Free
Download the 7-day trial. Test it on your charts and markets. Evaluate the signal strength system. No obligation.
✅ Fully functional trial • ✅ No credit card required • ✅ Instant download
After your trial, the full lifetime license is available as a one-time payment. No subscription. Lifetime access.
🛡️ Your Investment is Protected
30-Day Money-Back Guarantee: Try the Turning Point System risk-free. If it doesn’t meet your expectations within 30 days, request a full refund—no questions asked.
One-time purchase • Lifetime license • Free updates • Email support included
📚 Additional Resources
Compatible with NinjaTrader 8 | Requires active NinjaTrader license | Works on Windows PC